Summary
Overview
The Summary page provides a global overview of your performance across different channels, campaigns, and use cases in the Branch ecosystem. Here, you can quickly view analytics breakdowns for:
- All Data
- Journeys
- Quick Links
- Universal Ads
- Universal Email
Account Requirements
In order to access the Summary page, you need to be Self-Serve Customer or an Enterprise Customer.
Report Settings
Date Range
You can choose the following date ranges for your report:
- Last 3 Days
- Last 7 Days
- Last 14 Days
- Last 30 Days
- Last 90 Days
- Custom...
- By default, you are only allowed to look back up to 6 months of data.
There are built-in date ranges to choose from or you can have a custom date range selected.
Sharing
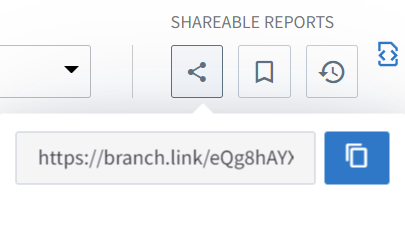
You can easily share the Summary page in its current state - i.e including whatever changes you have made to default view - by clicking on the link button and copying the auto-generated Branch Link. Users who have access to your Branch Dashboard will then be able to see the view you've shared.
Saving
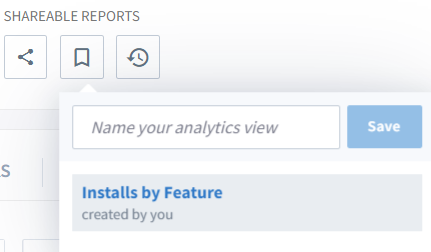
You can also save the Summary page in its current state - i.e including whatever changes you have made to default view - by clicking on the flag button, naming the view, and clicking Save.
You can also access your previously saved views here as well.
Reseting
You can reset the Summary Page back to its default state at any time, by clicking on the reset button.
Summary Tiles
Summary Tiles vs Table Data
There may be a difference in conversion proportions when comparing the Summary Tiles and the Events/Performance Tables. In the tables, the total unique will differentiate events based on their compare-by dimensions, leading to a greater count compared to the Summary Tiles.
Each summary tile includes the following information:
- Large number represents metric for current time period.
- Small number represents metric for previous time period.
- Arrow to right indicates whether metric has increased or decreased.
To change which event is shown:
- For the respective tile, click on the Pencil icon.
- In the Customize Tile modal, click within the Show drop-down.
- From the Show drop-down, select the event you want to populate the graph with.
- Click Save.

Each tile can be customized to show one of the following events:
Available SHOW Events
- Installs
- Pageviews
- Views
- Clicks
- Opens
- Reinstalls
- Web Session Starts
- Web to App Redirects
- SMS Sent
- Impressions
- Journey Dismissals
Summary Charts
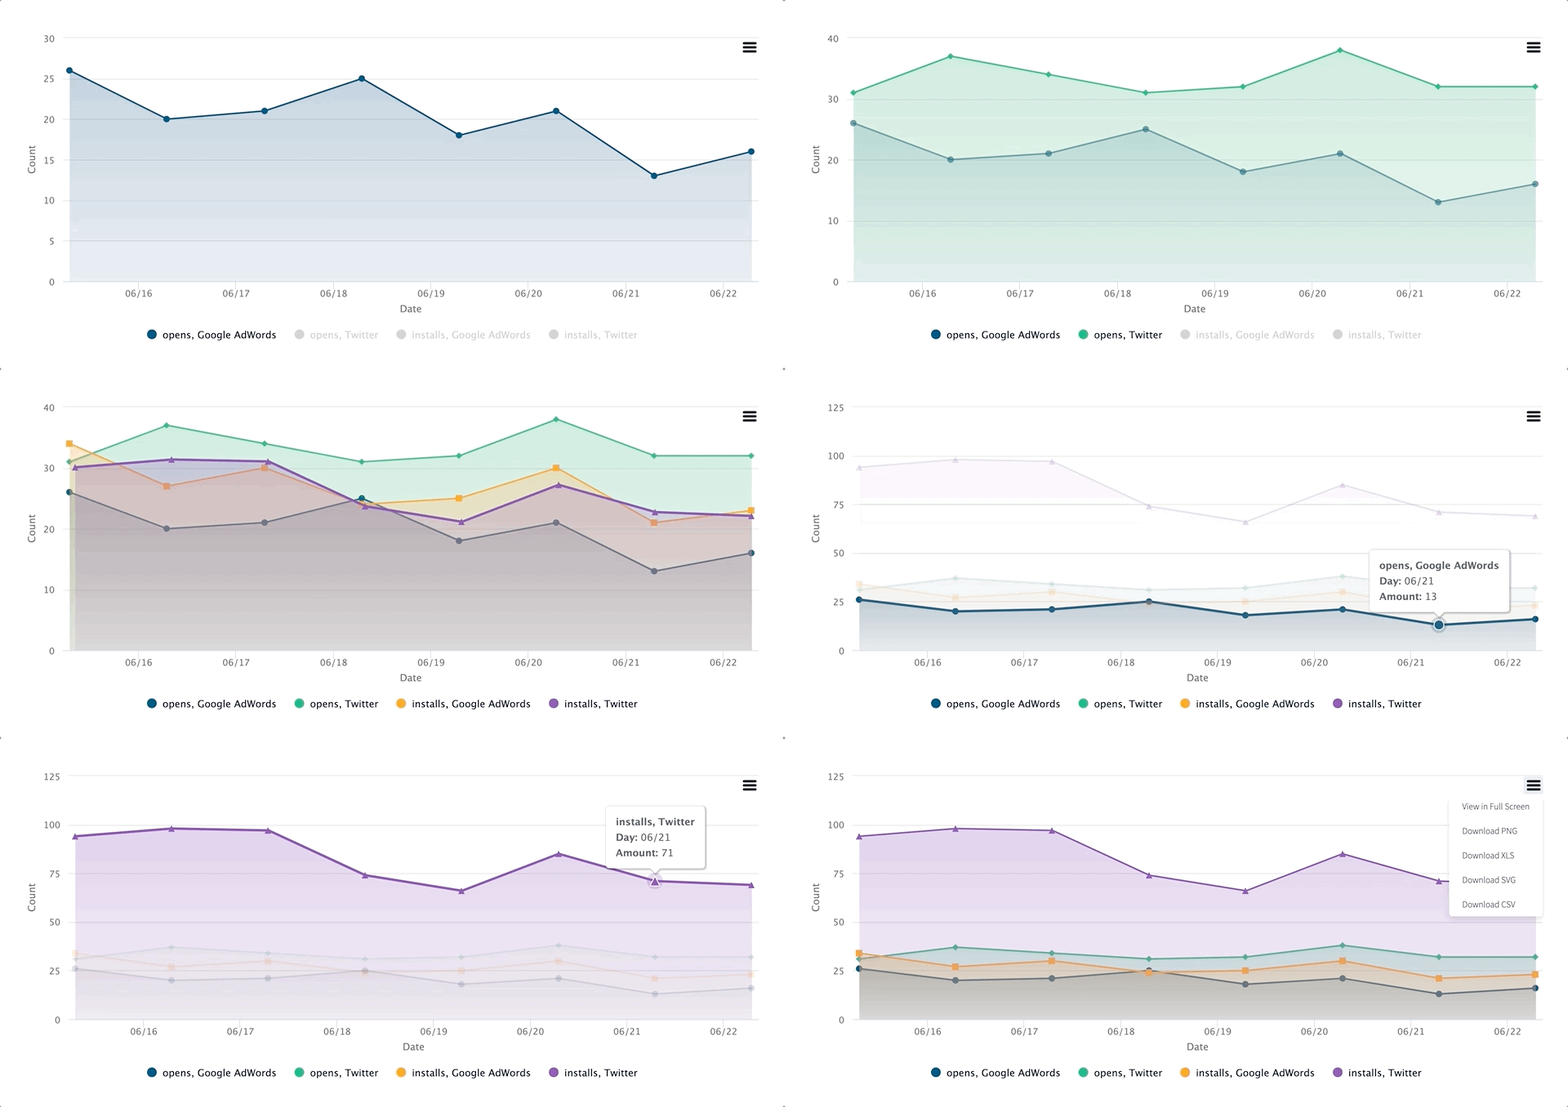
Summary Charts are an easy-to-use way for you to be able to see campaign performance quickly at a high level. It's a great tool to compare multiple data sources to find valuable insights.
Customization
Show
You can Show 2 values in which your chart will automatically conform to. Here, you'll be able to add helpful at-a-glance metrics like installs, purchases, etc.
Data Limits
Event/Metric Records
We will load the top 5,000 records for each event or metric. Some low-volume records may be missing from the displayed analytics when looking at many different compare bys. In particular, data sorted by ascending values may be limited.
Cardinality Protection
Branch limits all dimensions to 40,000 values per publisher per day. This means that you can only see up to 40,000 unique campaigns, ad names, etc in the Dashboard.
If an app tries to send up > 40,000 values for a single dimension (e.g. ~campaign) in a day, then Branch stops tracking those unique values. Branch combines additional values together and bucket them under the value "Other".
Compare By
You can add 1 Compare by value to break down your data by a specific dimension.
Filter
You can add 2 Filters to get more granular with the data shown in the Summary Chart. Here you can add specific values for keys like os, ad partner, etc.
Organic/Unique
When Unique is checked, Branch employs an algorithm to generate an approximation of unique users completing an event within a given time period.
For example: Within the time interval selected, if 1 user clicks 100 times, the dashboard will only display 1 unique click.
There is no concept of "unique revenue"; "revenue" is always the sum of all purchase events.
By default, Unique is shown.
When Organic is checked, unattributed data will show (attributed: false). This data is not attributed to any click or impression, and is the same as "organic" or "direct" data. By default, Organics are left hidden.
Views/Download
By clicking the button in the upper right hand corner of the chart, you have the ability to View in Full Screen or download in one of the following formats:
- PNG
- XLS
- SVG
- CSV
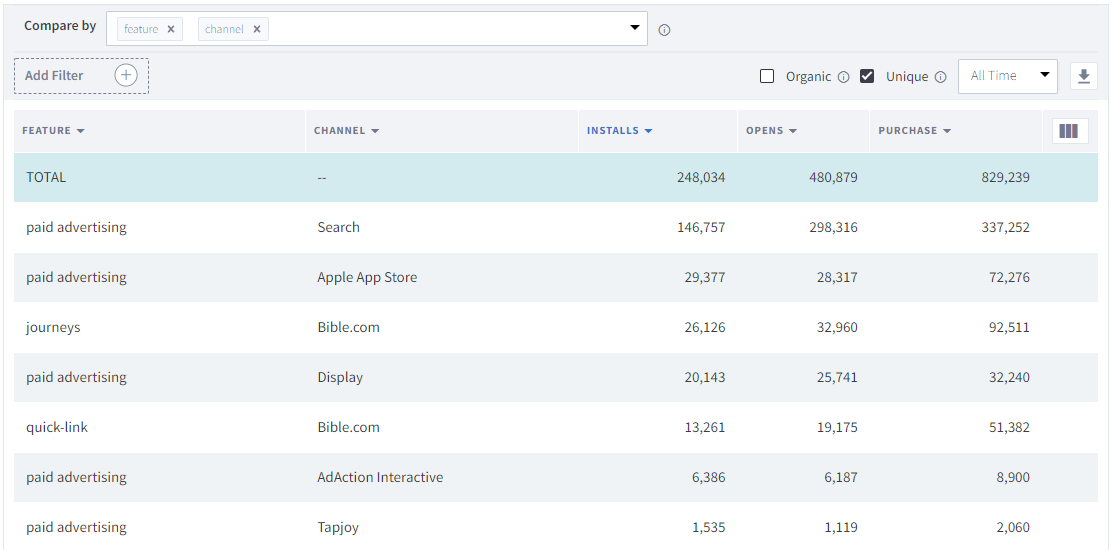
Events/Performance Table
For a full guide on customizing the events/performance table, view our guide on Dashboard Reports.
Updated 9 months ago


